
Measure the fluctuation instead of removing it
Thermal motion in a conductor produces tiny voltage fluctuations. Johnson noise thermometry uses those fluctuations to measure temperature. NIST’s project description explains how a quantum voltage noise source supplies a calculable reference for the comparison. Here, noise is the quantity of interest. [1]
Match two signals
NIST describes alternating the sensor and reference through amplifier chains, then digitizing and processing their signals. In its absolute mode, the reference noise power is adjusted to balance the thermal noise. A second measurement at another temperature can instead establish a temperature ratio. [1]
An established method with a specific history
The project page was created in 2015, updated in March 2025 and is marked completed. It describes using measurements to check a temperature scale, while demanding-environment applications are framed as future impacts. This is an explanation of an established measurement approach, not a new commercial thermometer announcement. [1]
Go a little deeper
Optional reading · about 1 more minute
The reference and the result have different jobs
Our interpretation: A reference gives a comparison something dependable to stand on. It does not make the rest of an instrument disappear. When evaluating a measurement claim, look for the full comparison procedure and its uncertainty, rather than treating the word “quantum” as a substitute for either.
What the picture is showing
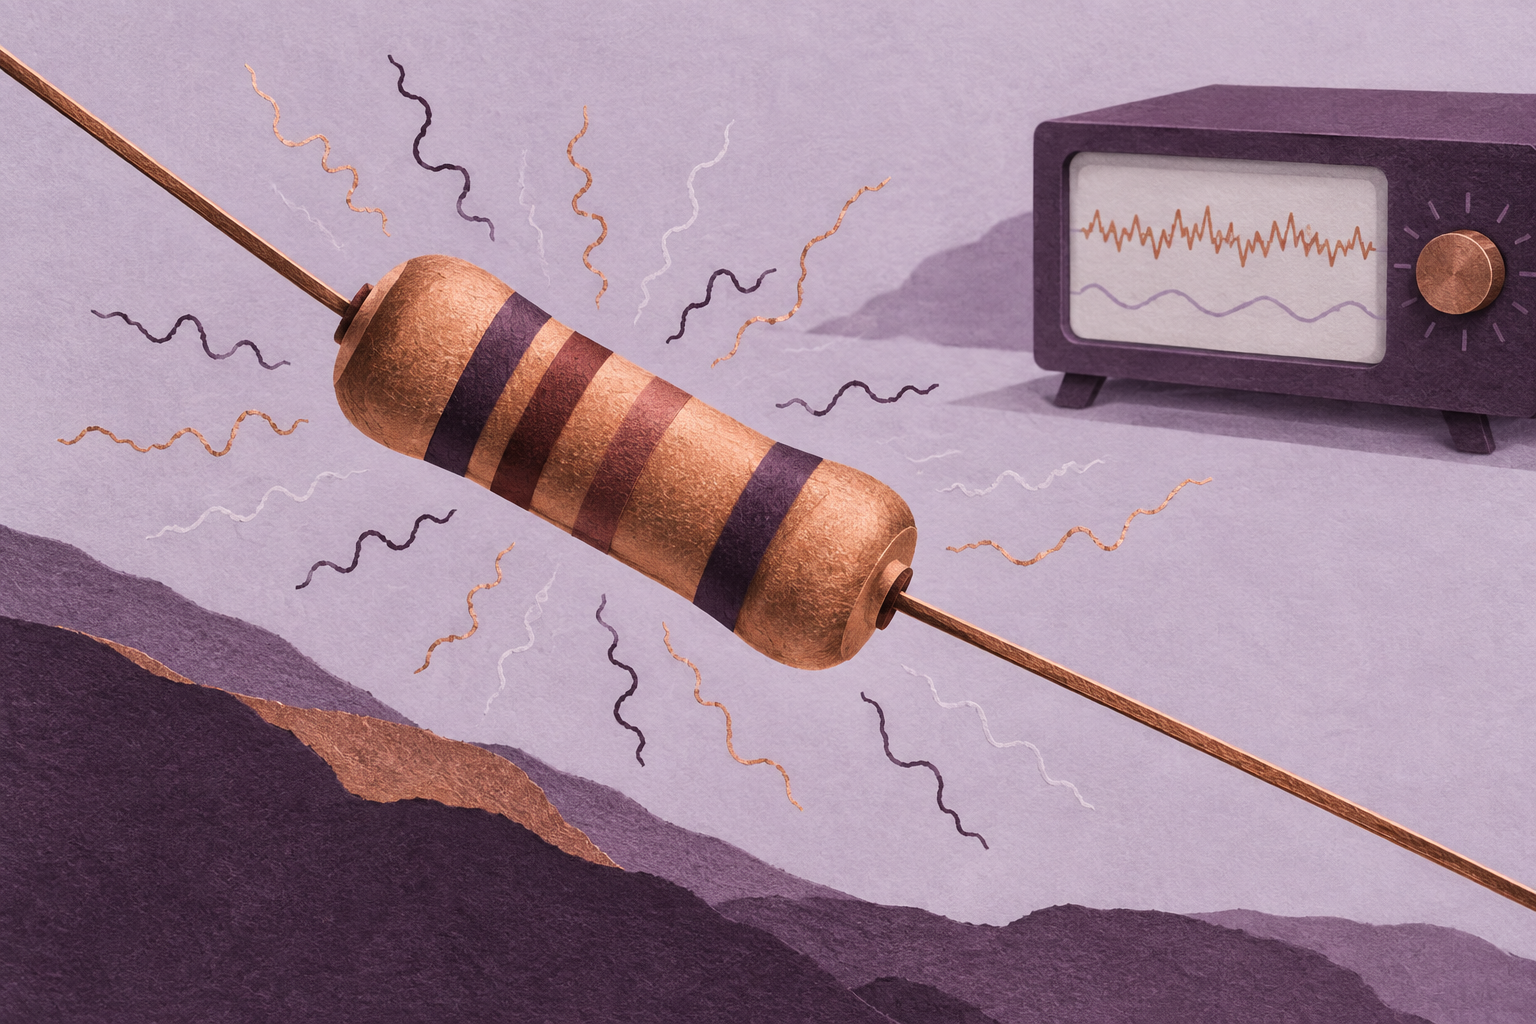
Illustration note: The irregular marks around the resistor are a conceptual depiction of fluctuations. They are not recorded voltage samples, an acoustic sound wave or a measured spectrum. The image does not reproduce NIST’s apparatus.
Original sources
Attributed synthesis, not original reporting. Examples labeled hypothetical or illustrative are explanatory. Reviewing a source does not independently validate its findings.
- NIST: Johnson Noise Thermometry ↗
Created August 28, 2015; updated March 26, 2025; completed project. Summary, technical approach, figure description and status read September 27. No uncertainty values adopted.